This Ain’t your Mamma’s Tuning

I have tried to stay with one concurrent theme with my blogs. I have been writing about the best way to use SQL Server Default tools. Not to say I don’t believe or trust in third party vendor tools to help analyze your data. I think those tools hold good value and can help save money and time. I believe in using what yo’mamma gave you. As I have mentioned before this will ultimately save your department money while still giving you the tools needed to exceed yearly expectations.

I have titled this blog This Ain’t your Mamma’s Tuning because the Database Engine Tuning Advisor (DTA) is not what is used to be. DTA is a sophisticated tool that will help you optimize your database by providing useful information. Then when you combine DTA with SQL Profiler, oh my gosh do you have the power of Grayskull at your finger tips. (Showing my age a little, and my nerd-ness.) As  I have blogged about in the past you have the ability to use Profiler and run several different kinds of traces, now lets talk about how we can load those traces into DTA and then analyze our findings. But first, lets review the features of DTA.

DTA Can:

  • Consider trade offs of physical design structures like clustered/non clustered indexes, views and even partitions. T-SQL commands are also reviewed; such as selects, inserts, updates, and deletes when selecting your troubled index combinations. This means that the overhead with your T-SQL commands are analyzed as part of the recommended indexing scheme. It will also look at trade offs in which columns are arranged.
  • Determine which physical structures are not needed in a database. It will find the indexes that are never used.
  • Look at the ‘What-if’s’. You can see if a particular index should be clustered or not to better optimize your performance.
  • Analyze single or batches of statements in a SQL Profiler trace which can be stored in native format, or in a table.
  • Work with statements that have UDF’s, triggers, or temp tables.

DTA produces several reports allowing you to really break down how your database is working on the inside. Basically DTA can help optimize your databases physical structures by looking at statements found at any level on the server.

Now the LumberJack Can:

  • Take the overhead of the trace and push it to a test server, even if the test server is not a perfect mirror of production.
  • Use either the GUI interface or a command prompt. The CMD can help use less overhead.
  • Choose to tune physical structures for one or several databases at the same time.
  • Choose how long to run a trace by setting a trace time. This is especially useful if you need a quick results on a statement that usually takes a long time to run. Basically your only looking at a chuck of the statement.
  • Save the analyses to review them at any time. This will help you compare results at different time periods.

Go Big or Go Home!

Not Really, actually in this case it’s probably best to ‘go little and get home’. DTA is only going to analyze three events so don’t use more then needed. In fact in most cases your trying to analyze performance issues so again, why put more on the server when your trying to eliminate that very thing. So Lumberjacks, you have two choices. You can run a low overhead trace or load up a low overhead workload file. I prefer to load up a low overhead workload file.

Low Overhead Trace

We need to keep in mind that the most powerful way to use this tool is to provide a workload file. The file should be from a trace that contains activity during high usage hours. As we discussed earlier lets keep these traces light weight. SQL Profiler offers a low impact template to address this very situation. Don’t worry about arranging columns or filtering columns in a low overhead trace. Save your trace to a file and not a table. Those little things can add overhead to the server. The Tuning template will capture what we need.

  • Stored Procedures
    • RPC: Completed
    • SP:StmtCompleted
  • TSQL
    • SQL:BatchCompleted

It also includes the seven data columns that will provide DTA more than enough. As you can see this is a lightweight trace. However, if you wanted to remove any of the events to make the trace even lighter, which on a overloaded production server is not the worst idea. You can create the trace from scratch and remove some columns. If you make it yours and it’s not compatible with DTA you will get an error. These are the columns that I put in any DTA trace, any others are of no use to DTA.

  • TextData: This will find what code is running in each statement
  • Duration: Not technically ‘required’ but it tells you which statements are taking a long time to run.
  • SPID: This is required when your gathering data for the profiler trace. DTA can use the SPID to identify which database the event took place.
  • DatabaseName: This is another one that is not required but lets be realistic you need to see which database your looking at.
  • LoginName: Not requied but again, it’s good to know who is running these statements. Could be a user or it could just be the application login.

On an overloaded production server the trace file will grow quickly. Be sure to keep an eye on the trace file and your allocated space. Again, run the trace during high usage to gather as much as you can in little time. DO NOT STOP the trace, use the pause button. You can always use the pause button if people start complaining of performance issues. It’s better to run the DTA on a single file instead of multiple little ones. If you stop it and have to create multiple files you can load them into a table later. However, it’s a pain to set up DTA to analyze all that. Just don’t stop it!

Kick the Tires and Light the Fires!

DTA can be launch from either SSMS or Profiler. You will need to log into the server that includes the database you want to analyze. Also note that your login must have sysadmin and dbo_owner.

Working from a Workload file:

Again you can analyze directly from DTA but in this blog we’re looking at running DTA from our previous trace. We are also looking at one database and it’s indexes.

Once DTA starts:

  1. Name your Session
  2. Choose the workload file you just created by click on the ‘Browse for Workload file’ icon
  3. Select the Database for workload analysis
  4. Choose the same database in the ‘Select databases and tables to tune.
  5. Click on the Tuning Options Tab
  6. Choose Indexes (This is the default option)
  7. Choose Full Partitioning
  8. Choose Keep all existing PDS

Click Start Analysis! 

Once you click ‘Start Analysis’ a Progress tab will open. You should see a Tuning Progress window.
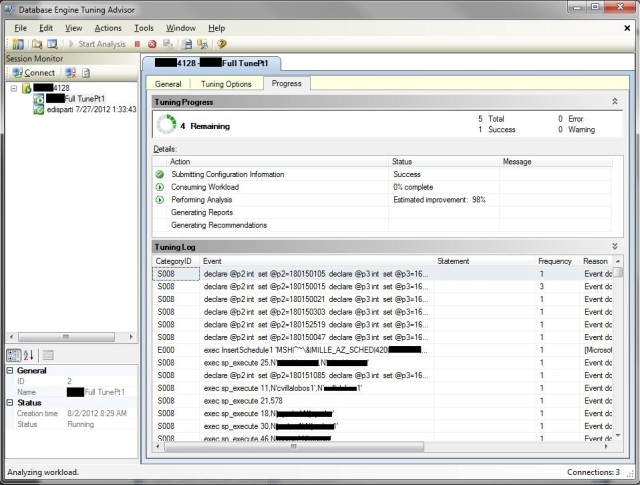
This process can take minutes or hours depending on your workload file and how long you ran your trace. When it’s complete it will open to the Recommendations Tab. You will see Partition Recommendations and Index Recommendations. It will also show you the percentage improvement in performance if you implement all the recommendations. The actual percentage of what you get, if you implemented all the recommendations is most likely less due to the workload file. Unless you ran your trace all day, and your DTA took very very long to analyze that percentage is not entirely accurate, but you will still see improvement.

The Reports Tab will show you the ‘Tuning Summary’ details. This will show you how many statements can be tuned, how many index recommendations are suggested, etc. You also have the option of extra reports. At the bottom of the reports tab you will see the ‘Tuning Reports’ section. Expand the drop down and view the different reports. I like to use these when sending recommendations to vendors. Always choose both the ‘current’ and ‘recommended’ reports for comparisons.

Do I Accept all recommendations?

No, no you don’t. This is where YOU can shine. A lazy and very optimistic DBA will accept all recommendations. However, my fellow lumberjacks you need to review the recommendations and save the results. I’m not saying I’m not confident in DTA, I’m saying be smart. Look at this trace and DTA as a baseline. Click Actions > Save Recommendations.

Go re-run your trace, maybe at a differnt time of day and see what DTA recommends. If you find DTA is making the same recommendations it’s a safe to say it’s a good recommendation and go ahead and implement that change.

If for instance it’s a index creation you can do it manually or let DTA implement automatically. Personally, I like to do these manually and document everything I do. Am I Union? Anyway… If you want to allow DTA to implement them automatically just make sure the check box is checked next to the each recommendation. Since applying these recommendations is likely to slow down the server, possibly even dropping an index and creating a new one in it’s place; you want to schedule these to run during a scheduled outage/upgrade. If you have been in the IT world long enough you know exactly what I’m talking about. When you click Actions > Apply Recommendations you will get a ‘Apply Recommendations’ window where you have the option to ‘Schedule for later’. Since I like to do these manually I like to click the definition link and find the raw T-SQL Code. I will then copy that to the clipboard and run each on in SSMS. I will always recommend running these in a test environment prior to running these in production. When you run these recommendations either manually or automatically in a test environment you will get an fair idea of how long your outage will be and if the recommendations are successful. Please Please always test first.

Good Job!

As I said ‘This Ain’t your Mamma’s Tuning’. DTA is an amazing tool that every DBA should play with before using third party tools. If you running DTA on a vendor supported database and send those recommendations to the vendor they “should” be more open to those recommendations over a non-Microsoft tool. If your department has the means or already have third party tools…by all means use both. For now, DTA is awesome and you already have it in your tool shed. Don’t go asking for a sharper ax when you already have a pretty nice one.

Posted in Uncategorized | Leave a comment

Indifferent Performance

When you title your blog entry Indifferent Performance everything you write all of a sudden sticks. While the title is possibly catchy the way you explain it; is a classic battle between good vs. bad.

We find this very thing in SQL Database Performance. There is going to be scans that are either good or bad. How the database was created will determine which type of scan is the best scenario. We need to run a trace to see which one is appropriate. Please take a second to read about each  type of scan.

We need to select a few different events and run a few different scans to identify the tables or indexes causing the performance problems. Once we have a baseline set of scans we will be able to investigate where our performance hits are.

The first event you need to capture in any of the scans is the Scan:Started Event. This event is captured when ever a table or index scan is started. This will also be the big hitter to help identify excessive scanning. As always this will not be the only event you capture. Here is a list of all the players and their locations in the Trace Properties > Events Selection.

  • Scan:Started: Scans
  • Scan:Stopped: Scans
  • SQL: BatchStarting: TSQL
  • SQL: BatchCompleted: TSQL
  • SP:Completed: Stored Procedures

When you select the data columns you will have to pull more then you believe is necessary. Some of these events do lack useful and needed properties. So you have to collect more which will obviously take more out of your server so I would recommend running this trace for an hour at a time. You are going to gather a significant amount of data in that time. Be sure to select the following data columns where available.

Application Name
BinaryData
CPU
Database Name
Duration
EventClass
EndTime
Event Sequence
IntegerData
Login Name
Object ID
ObjectName
Reads
SPID
StartTime
TextData
Writes

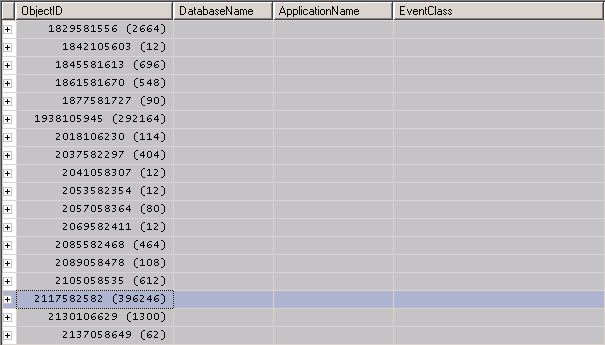
In the past I have filtered on the EventClass. For this trace I’m going to filter on the DatabaseName. This will allow me to look at performance on just that database . It’s also a good idea to group by ObjectID. This will reduce the amount of data on the page and allow for easy analyses.

Ready to Run the Trace!

As I have discussed on previous blogs it’s always a good idea to run a baseline trace. Maybe your first trace can be during normal business hours. Then run another trace during high usage hours.

Breaking It Down

Here is an example of a trace that ran for 1 hour.

This could be Indifferent Performance. At this point these are just numbers.  As you can see the highlighted row has 396,246 scans in one hour. Again, just a number right now until we know if it’s a problem. Time for some good old investigation.

Let’s first look Object ID 2117582582. We can get the name of the object and look even further.

SELECT name
FROM sys.objects
WHERE object_id = 2117582582

This tells me that the name of the table that is running the object. Query that table and find out how many rows are in that table, so we know if it’s small or large. If your dealing with a large table you should look at the indexes on the table. Are they cluster or not? If they are not clustered, well a clustered index is more efficient on columns that are searched for ranges of values. This could be red flag if it’s not a clustered index and it is a large table. At this point I would recommend creating clustered indexes. Also query the table with the Actual Execution Plan. See if it coded to use Table Scans, Index Scan, or Index Seeks. If you using a Table Scan on a huge table; that’s another red flag. Switch it to a Index Seek to speed things up.

Of course it could be an clustered index but the index is still in need of care. When dealing with an object like we are it’s a good idea to view the context of the code and find if it’s a stored procedure. In your results window disaggregate the data by selecting View > Aggregated View (Unchecked). Get to a find window and search on your Object ID to see when the first time this object was scanned. Look for the SP:StmtCompleted event in conjunction with the SQL:BatchCompleted event. With these two events you can see the code within the SQL:BatchCompleted, the CPU, Duration, and Reads. You will see if it’s a stored procedure or not. If these events are high you have a red flag, if not then you need to evaluate the code even closure. This Blog would be mammoth if I discussed code reviews. However, I would recommend regular code review calls with your DBA and software programmer. You may determine it’s possibly to look at adding indexs to the table and turn Table Scans into Index Seeks.

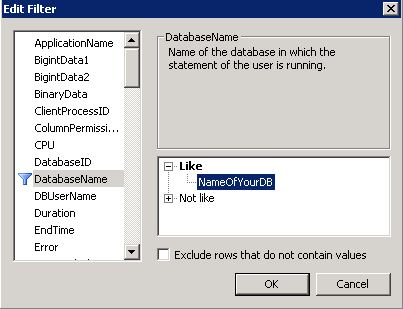
We we covered a lot of ground and no I did not get into every option of finding the performance hit. Keep running scans during both high usage and low usage hours. Run them for an hour only as it could cause performance issues themselves. Try to find the objects that are running the most and determine if they can be better optimized through clean indexes and Index Seeks. Once you find a few objects that are heavy performance hitters you could run a trace on the duration of that specific object. Read my blog on SQL Server Monitoring Pt. 2 – Run a SQL Profiler trace during high usage hours for more information. Once that trace is set up use the Column Filters to scan the ObjectsID’s that you found are running the mostThis will give you more details on how long the Objects is running.

Posted in Uncategorized | 1 Comment

Application Overkill

Since I started in this trade one thing has always stood firm. Applications are slow, and will always be slow because we as a human society want results faster than they occurred yesterday. Which is funny because back in the day things happened faster for the most part. Now we have technology making everything more “seamless”, but can take longer. I love talking to our older generation. You can tell them how long something will take and it’s just an opening for them to say how the good old days were. You have to love those story’s. Anyway, I digress.. I titled this blog entry Application Overkill because I wanted to discuss how statement complications can be a bit overkill and adversily effect your application because of it.

My first IT position was supporting AOL. It was one call after another. I never even had to press a button, the call just came though. It was a bit boring because 80% of all my calls were instructing people over the phone on how to “clear the cache” in I.E. Therefore, now whenever I read or hear about cache in any aspect my AOL days resurface. I do actually laugh because at that time I thought I knew so much about computers. I was gods gift to the PC industry. When I read about Plan Cache in SQL Server, I laugh. Just like in any browser when you access a site it’s cached into the PC so the next time you want to access the site it will load faster. SQL Server has the same way of doing things. When you run a query, batch file, stored procedure, or any type of statement those are stored into the ‘plan cache’. Now, just like in IE this is normal but it can begin to cause problems. In some cases these statements need to be revamped which is normal but can become excessive, rendering SQL performance. Here is how the the SQL Lumberjacks can identify those cases and “clear the cache”.

SQL:StmtRecompile is our trusted low impact friend today. This event will capture statement level recompiles. So it’s not alone at the dance also include StmtStarting and StmtCompleted. Lets really break these down.

I’ll always highly recommend reading about these events before you execute your trace. They can speak for themselves but we all know what happens when you assume. Also, if your dealing with vendor supported databases it’s best to error on the side of more events than less. Yes, you may start rendering SQL performance a little but if you don’t include these now the vendor will ultimately ask questions, where these event captures could provided answers to. I would also include these:

To select these events in SQL Profiler you first want to select a blank template. In the Events Selection tab you need to expand the following sections to find the above events:

  1. TSQL
  2. Stored Procedures
  3. Performance

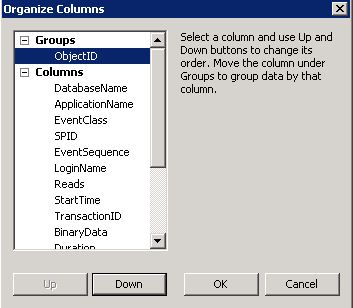
As far as which data columns to select, if you place the results into a table it really does not matter. You can query to table as you please. Otherwise in the Trace Properties window click on Organize Columns. At the top you’ll see groups, move EventClass up into the Groups section. This will the collapse everything in the window so you can easily choose what you want to view.

Run the trace and let’s break this down.

I would recommend running this query during high usage hours to capture the highest level of frequent statement complications. Keep in mind this does put some load on the server. Not as much as others, but it can slow the server down depending on the build.

You can see below how Grouping the EventClass makes it easier to view.

Wow! 1382 StmtRecompile is that a lot? It’s all relative based on your  baseline trace. It’s always a good idea to have a baseline trace on multiple servers and multiple applications so you have some depth to compare it to. We should be looking at the number of starting compared to the number of completed. In this case the of the 34049 that were started 1382 were recompiled. This is a pretty good average. We would like to see a low number of recomplies compared to the number started. If the number of recompiles is over 75% of the number started that should cause some concern.

You can open each of the sections and review all the different columns. What you need to pay close attention to is the EventSubClass section. You will come across ‘Statistics Changed’ and ‘Deferred compiles’. These are your heavy hitters that cause a recompile. However, several other parameters can cause recompiles. If you notice a large number of one parameter then you need to look closely at that specific one.  It’s also a good practice to look at the different statements and objects. You may find there is a relationship between the two that is causing problems.

The next time you find your databases taking a long time or the next time you find an application taking forever just remember, you can find the cause. The cause could be easily fixed, it could be the server is old and slow, could be the application having a hard time recompiling events. As SQL Lumberjacks we need to remember, especially dealing with vendor supported applications we can’t always fix it. We can always, without a shadow of a doubt find the problem. We as SQL Lumberjacks have to be in sales sometimes and convince the vendor to buy into your findings and agree to fix the problem, or in this case ‘Clear the Cache’.

Posted in Uncategorized | Leave a comment

That’s So Lumberjack

In a post I made a few months back I was going to research three avenues of optimizing a database. The first was a custom script created to monitor blocking, and the second was running a SQL Profiler trace to monitor high usage hours. The second was screwed a little and I blogged about creating a SQL Profiler trace to look for internal application queries that take over a minute to run. Granted there are several traces that can be run to monitor your database during high usage hours. The one I wrote about, I believe to be a very useful solution. The third, well that’s not very SQL Lumberjack of me. It was Research SQL Monitor (RedGate Tool) to monitor my database. The third is going to cost my department money. Which (Old Adage in a monotone voice) in these economic times anyway to save your department money and still exceed expectations will take you far in your career. My director asked me a question that I will never forget, in fact I will remember this for the rest of my career. I wanted two more physical drives for a new server. She asked me “If this was your money would you buy the drives?” My immediate response “I WOULD NOT HAVE BOUGHT THE SERVER!” Therefore, to stay true to form I will continue to write about being a Lumberjack without an axe, i.e saving the department money using your default tools. I’m going to explore some other methods of using SQL Profiler to troubleshoot database performance problems.

There are several ways to troubleshoot different areas of SQL Server. Using SQL Profiler is another way to be a SQL Lumberjack. I would like to explore all of these areas over the next few months. First, lets dive into the ever popular “How to Identify Memory Problems”

In my research I have found there are a few key types of events that can help identify memory leaks. I would recommend reading each one before kicking off your trace.               They are: (I also included the path to each event in SQL Profiler)

  1. Hash Warnings Events > Errors and Warnings > Hash Warning
  2. Sort Warnings Events > Errors and Warnings > Sort Warnings
  3. Execution Warnings Events > Errors and Warnings > Executing Warnings
  4. Server Memory Changes Events > Server > Server Memory Changes

It’s a good idea to run this trace over a 24 hour period. If your trace finds memory leaks, keep in mind it may take several traces to find any. If you ran a trace and in 10, 20, 30 minutes and you hit several events that is a cause for concern.  It’s also a good idea to run a secondary trace with the following additional events. Again I would recommend reading up on each event before you run a trace. You have to know what your looking for.

  1. RCP: Completed
  2. SP:StmtCompleted
  3. SQL:BatchStarting
  4. SQL:BatchCompleted
  5. Showplan XML

Now that your trace has completed what are we looking at. The big thing you want to look for is Execution Warnings and Server Memory Changes. The others are for the most part normal operation but we still need to be mindful of them. The Execution Warnings can be considered normal. If you see a few scattered around in a 24 hour period that is normal. In fact it’s a sign that your application is being used, and it’s operating sufficiently. When you see an execution warning you need to look at the duration column. If it says 30000 that means that operation had to wait 30 seconds for memory to free up before it could execute. Time is an interesting thing is’t it? While 30 seconds to one person may not seem that long, to an IT person it’s a waste of your life. That’s why we are in the position we are in. Your users should not have to wait 30 seconds for an operation to execute. You can set a duration in the trace to only populate if the duration exceeds 20 seconds (20000 Ms). Otherwise 5, 10, 15 seconds is not to bad if, BIG IF they are scattered around the trace. If they are happening consecutively within (This is arguable based on project expectations) 10, 20, 30 minute time frame you may want to consider increasing the memory on the server. Worst case scenario, you will get time out errors in your trace which is a red flag that memory is a problem. Server Memory Changes is SQL Server and the OS playing tug-of-war. This is common when a server is restarted and the application immediately starts running events such as queries or stored procedures. The two will be fighting for RAM as they try to execute processes or events. Once one finishes it gives some RAM back and so on and so forth. This will create Server Memory Changes in your trace. In the event subclass you will see 1 – increase or 2 – decrease. This is common when the server starts up and should not cause a concern unless you get time out errors. When you see a lot of these during normal business hours that could mean more memory is needed.

What!! The SQL Lumberjack is telling me to go to my directory and ask them to spend money on memory. C’mon now, would I do that? In some cases yes, yes I would. This maybe one of them. Ultimately you need to satisify your project expectionations. However, you can tell SQL Server to only utilize ‘X’ amount of server memory. See Server Memory Options for more details. This will help increase the performance of the server. On the flip side it will increase the amount of Execution Warnings on the trace. This really boils down to.. do you ask to spend money, or do you ask the project to be mindful of the server limitations. Ya know…sometimes it’s both

So until next week…. Tomato, fruit or vegetable?

Posted in Uncategorized | Leave a comment

Qualities of Exceptional Employees

In the past two weeks I have seen these qualities pop up in two different sources. I believe these are all very valuable. While I do possess the qualities in number two (Please keep you jokes to a minimum) I think number two stinks, in reference to this column. I think it’s fun to be that person, it’s not necessarily a quality you need to have to be a good employee.  I have worked with several people that were awesome to work with but did not hold one of these the behaviors in number two.

The interesting part about these is they will not make it on your annual review. Your review is reserved for the work you have completed in the past year. These are simply behaviors you could resemble.

Here are 8 behaviors to make you an Exceptional Employee. Keep in mind I did not write these.

1. They ignore job descriptions. The smaller the company, the more important it is that employees can think on their feet, adapt quickly to shifting priorities, and do whatever it takes, regardless of role or position, to get things done.

When a key customer’s project is in jeopardy, remarkable employees know without being told there’s a problem and jump in without being asked—even if it’s not their job.

2. They’re eccentric… The best employees are often a little different: quirky, sometimes irreverent, even delighted to be unusual. They seem slightly odd, but in a really good way. Unusual personalities shake things up, make work more fun, and transform a plain-vanilla group into a team with flair and flavor.

People who aren’t afraid to be different naturally stretch boundaries and challenge the status quo, and they often come up with the best ideas.

3. But they know when to dial it back. An unusual personality is a lot of fun… until it isn’t. When a major challenge pops up or a situation gets stressful, the best employees stop expressing their individuality and fit seamlessly into the team.

Remarkable employees know when to play and when to be serious; when to be irreverent and when to conform; and when to challenge and when to back off. It’s a tough balance to strike, but a rare few can walk that fine line with ease.

4. They publicly praise… Praise from a boss feels good. Praise from a peer feels awesome, especially when you look up to that person.

Remarkable employees recognize the contributions of others, especially in group settings where the impact of their words is even greater.

5. And they privately complain. We all want employees to bring issues forward, but some problems are better handled in private. Great employees often get more latitude to bring up controversial subjects in a group setting because their performance allows greater freedom.

Remarkable employees come to you before or after a meeting to discuss a sensitive issue, knowing that bringing it up in a group setting could set off a firestorm.

6. They speak when others won’t. Some employees are hesitant to speak up in meetings. Some are even hesitant to speak up privately.

An employee once asked me a question about potential layoffs. After the meeting I said to him, “Why did you ask about that? You already know what’s going on.” He said, “I do, but a lot of other people don’t, and they’re afraid to ask. I thought it would help if they heard the answer from you.”

Remarkable employees have an innate feel for the issues and concerns of those around them, and step up to ask questions or raise important issues when others hesitate.

7. They like to prove others wrong. Self-motivation often springs from a desire to show that doubters are wrong. The kid without a college degree or the woman who was told she didn’t have leadership potential often possess a burning desire to prove other people wrong.

Education, intelligence, talent, and skill are important, but drive is critical. Remarkable employees are driven by something deeper and more personal than just the desire to do a good job.

8. They’re always fiddling. Some people are rarely satisfied (I mean that in a good way) and are constantly tinkering with something: Reworking a timeline, adjusting a process, tweaking a workflow.

Great employees follow processes. Remarkable employees find ways to make those processes even better, not only because they are expected to… but because they just can’t help it.

I would love to get your comments on this one.

Posted in Uncategorized | Leave a comment

Carving Your Career

I’ve decided to take a week off my research and write about something we all think about, our career. I believe that your our current job is a vehicle for our career. Your vehicle will take you on an awesome road tip filled with sight seeing, rest stops, and most importantly the City of Retirement. It’s your responsibility to keep up with routine maintenance on your vehicle. Yes, vehicles will break down to no fault of your own. I have been stranded on the side of the road and I hope to never be there again. Everyday I treat my job as the vehicle that will take me to retirement. I enjoy reading SQL books, blogs, and anything that will….fuel my vehicle. What’s also interesting is, someone else watches my driving. Someone who will critique my vehicle and how I take care of it. This theory of measurement is what interests me. The Art Of Possibility fascinates me.

Carving of any kind is an art. It takes skill, patience, understanding, and you always have to have the final project in mind. You cant carve anything unless you can see in your mind what your building. I learned this as a young boy working in my grandfathers wood shop. He was a high school wood shop teacher and retired shortly after I was born. He had his own wood shop that I spent many hours in. One of my first wood projects was a wooden   California Least Tern. The California Least Tern is a endangered bird. A protection group asked my grandfather and other wood carvers to carve out hundreds of these birds. They wanted to have this birds with long stick attached to bottom. The took these birds and stuck them into the sand. These wooden birds were decoys. The real birds saw these wooden birds in the sand and followed by example. They nested in the sand. The protection group protected this area of sand.

Michelangelo is often quoted as saying inside every block of stone or marble dwells a beautiful statue; one need only to remove the excess material to reveal the work of art within. As a young boy I took a block of wood and little by little carved a little beautiful wooden bird that helped greatly increase the number of California Least Terns. How can that be measured?

How can we apply this concept to our career? We need to carve off all the excess wood and along the way we will be measure. It was in the book The Art Of Possibility that inspired my blog entry. In Third Practice discusses “Giving an A”. “An A is not an expectation to live up to, but a possibility to live into” So how do we apply that to our little wooden California Last Tern. ie. our Career. In the The Art Of Possibility  Ben and Roz decided to give all their students an “A” at the beginning of the semester. They were not measuring their students ability to learn. What they did was open their minds to achieve something that is not really being measured. The one requirement to earn this ‘A’ is they needed to write a letter dated next year. The bases of the letter was “I earned my ‘A’ because.” The needed to explain detail of their past year. They need to look back at what they accomplished, what they learned, and how they were better today because of the last year. As I mentioned earlier “You cant carve anything unless you can see in your mind what your building.”

Each of us during our career will be reviewed. What if our boss told us the same thing as Ben and Roz told their students. “I’m going to give you the heights marks, but I want you to write a letter explaining…..” etc. Here is my letter:

Dear Mr/Mrs. Boss,

When I found out I would be getting top marks on my review this year I was puzzled with great excitement and confusion. All I had to do was write a letter, really! One could think “wow free pass” while another could think “this is some kind of mean test”.  I wondered how I could I ever measure up to such a high mark. I almost felt like I was being set up to fail. So after a few hours of thought, intense sweating, and dehydration I came to a conclusion. Not only was I going to earn my top mark, I was going to do so awesome my management would not have had any other choice. Granted the top mark was already giving, it was the desire to earn it that made it real. So the desire was real, the work was far more intense. What I put myself through in the past year has been so rewarding I find it difficult to put into words. Doing a good job is hard that’s why it’s called work. However, being I accomplished so much, learned more about this trade then I ever thought I would, and exceeded so many expectations I feel as though I have not worked a day in the last year. Carving my career in the past year has been like carving a beautiful rose out glass. I can see this rose and it’s amazing. Whats also amazing is it’s still very fragile. As long as I take care of this glass rose it will stay beautiful forever. If I miss use it or handle it incorrectly…..

Your Humble Employee,

Erik M. Disparti

Posted in Uncategorized | Leave a comment

SQL Server Monitoring Pt. 2 – Run a SQL Profiler trace during high usage hours

As my research continues I should point out that these tools are pretty sharp. SQL Profiler while not the sharpest ax in the tool box, it’s still a very powerful tool. There are numerous traces you can run to iron out the most simple problems. There are some drawbacks. The more parameters you put into your trace, the more load you put on your server. This begs the question “If I’m trying to identify a performance issue, why would I put more load on my server” I guess it’s like the old adage “You need to spend money to make money”. However, in the case we are going to look at today SQL Profiler is not that expensive.

In my situation I support many vendor developed databases, as I have talked about in previous blogs. I have been working with vendor applications my entire carrier. Vendors love to point the finger at our server, our desktops, or anything to put us in our place. That’s fine point your finger, I will point back with a different finger. My finger will get the point across. This SQL Profiler will identify the front end queries that are tacking the server. We will find out what query’s take over 60 seconds to run. In the end we can save the results and send them back to the vendor. The vendor can then see how their query is effecting the server performance.

So lets get started! Be sure to kick this off in the morning or create a scheduled job.

  1. Launch SSMS
  2. Tools > SQL Server Profiler
  3. Connect to your server
  4. In the Trace Properties Window > General Tab
    1. Trace Name: “SQL Lumberjack is Awesome” (or whatever you want)
    2. Use the template
      1. TSQL_Duration
    3. Check Save to File
    4. This will open a Save As window
    5. Save your .trc file
    6. Check Enable Trace stop time
      1. Note: Run this trace during high usage hours. I love to run this trace during the first or last business day of the month.
    7. Go to the Events Select Tab
      1. Make the following selections (You may have to check Show all columns)
      2. Click Column Filters
      3. Click Duration
      4. Expand ‘Greater than or equal’
      5. Type 60000 (60 milliseconds)
      6. Click Ok
    8. Buckle your seat belt
    9. Click Run
  5. Now envision the vendor shaking in their boots 🙂

I like to keep the trace window open to monitor the results. Once it’s done review your saved file. This trace can go either way. You may only get one or two hits, which is fine and I have experienced that result. You can always adjust the duration time but you will want to analyze why your adjusting it. If you have several hits send that trace to your vendor. 

I have adjusted my research plan. Instead of looking at SQL Monitor (RedGate Tool) I will be looking at the Database Engine Tuning Adviser to tune indexes. SQL Monitor is a very sharpe ax. I’m the SQL Lumberjack… I will continue to look at those options that are not as sharpe.

Lets be honest in most cases these will save your department money. You can take that to your review.

Posted in Uncategorized | 1 Comment

SQL Server Monitoring

It was only in due time “Erik please find a third party tool that can monitor our database for performance issues and blocking.” The time is now. So in my option I have about three options.

  1. Create a custom script to monitor for blocking
  2. Run a SQL Profiler trace during high usage hours
  3. Research SQL Monitor (RedGate Tool) to monitor my database. This would be getting a sharper more expensive ax.

I have made numerous suggestions on how to speed up the databases. However, keep in mind with vendor supported databases, those databases are their babies. Asking them to change something, even though they are getting paid by your company – is like asking a mother to cut her daughters long blond beautiful hair to rival Sinead O’Connor. There has been weekly calls with the vendor to discuss how we can improve performance. As of right now they are focusing their time and energy to prove it’s a network/end user PC issue. Since I believe this is a waste of time I know they will come to the DBA to say, how can we improve performance. Therefore, my new task could not come at a better time. My new goal is to find way to kill two birds with one stone. Let the research being.

First, a script that will monitor for blocking:

NOTE: Before you do this you will need to Configure Database Mail on the server.

Add this script to a SQL job and have the job run how ever often you feel as necessary.

DECLARE @Email varchar(max)
select @Email= ‘SPID ‘+convert(varchar(4), B.spid)+’ is blocking SPID ‘+ convert(varchar(4), A.spid)+char(13)+char(10)
+ ‘Transaction Information: ‘+case B.open_tran when 1 then ‘Open Transaction’ else ‘No Transaction’ end +char(13)+char(10)
+ ‘Waittime: ‘+convert(varchar(20), A.waittime) +char(13)+char(10)
+ ‘Blocked User: ‘+convert(varchar(20), A.loginame) +char(13)+char(10)
+ ‘Blocking User: ‘+convert(varchar(20), B.loginame) +char(13)+char(10)
+ ‘Command: ‘+ convert(varchar(20), A.cmd) +char(13)+char(10)
from master..sysprocesses A join master..sysprocesses B on A.blocked = B.spid
where B.spid <> A.spid
IF (@@ROWCOUNT>0)
BEGIN

EXEC msdb.dbo.sp_send_dbmail
@profile_name = ‘ProfileNameFromDBMailConfiguration‘,
@recipients = ‘YourEmail.com; anotheremail.com‘,
@body = @Email,
@subject = ‘ServerName – Blocking Occurring!!!’,
@body_format = ‘HTML’

You do need to keep in mind that blocking is normal. If you have this job run every 5 minutes you will see periodic blocking. However, by the time you get into the server the block maybe have already been cleared. Essentially this script is a good starting point for monitoring. I like to run the scrip every five minutes. If I get an email I will read the email but not take action until I see another email. 

Next Blog: Run a SQL Profiler trace during high usage hours. We will kick off one of the most low impact profile traces on a server.

Posted in Uncategorized | Leave a comment

Vendor supported databases

Here in my profile I title myself as a blogger and look, I have not blogged since April. Sorry to those 5 people who may actually read by blog.

Ok..So there was a DBA, The Customer, and the Vendor. Sorry have you heard this one.

As a SQL Lumberjack you need to find how very interesting, challenging, rewarding, and overall exciting it can be when your handed a project that will be ultimately be supported by a vendor. If you can’t find that emotional connection I’m afraid your project, which will ultimately be a supported application, will continue to hunt you every time an issue arises. I was recently handed a project to get SQL Server set up so the vendor can install a database. Here were my requirements for the project, keeping in mind I had to work with the vendor through each step.

  1. Install SQL Server 2008 R2 on a virtual box
  2. Create an extract from another database to feed profile information for the new database
  3. Create an SSIS package
    1. Create a OLE DB Source which houses the SQL Command from the previous requirement.
    2. Push the extract to a Flat File Destination
    3. Extract as a text file in tab delimited format
    4. Schedule a job to run the SSIS package twice a day
  4. Create maintenance plans for the database

Regardless if you’re a DBA of a home-grown database or a vendor created database your ultimate job does not change. You are the Default Blame Acceptor if something goes wrong. Remember, your company is paying this vendor money. Don’t be afraid to light up the vendor if you disagree with something. They can create the database, the schema, the index, and the views. That’s fine. YOU, create the maintenance plans, you create the optimization plans, you make the calls on how best increase performance on the database. Here is where art comes in, don’t be afraid to light them up, but you still need to sell them on why it’s best to set up the database in the way you want.

When my vendor created their database and it popped in my server I found things that were wrong, it was not my standard setup for a database. I took action immediately. The recovery model was not full, the auto shrink was true, and the compatibility level was SQL Server 2000 just to name a few. First thing I did was send a detailed email about why I want to change these options. Also, always try to avoid the middle man. You get level one on the phone who know nothing about SQL Server and they will end up screwing up your details. Just tell them you need to talk to the Database Developer.

End the end if you keep the control in your court you will have that emotional connection to the database.

Posted in Uncategorized | Leave a comment

Creativity in Database Backups

That’s right it’s time to go all Martha Stuart on this DR plan. And by that I do not mean cheat the system and call your co-workers worthless humans.

I am about to discuss Backup Stripping and is it best to send large backups across the network just to keep them off your local system.

“Marley was dead, to begin with. There is no doubt whatever about that.” Now I am not Marley but I am a SQL Lumberjack and I was faced with an interesting scenario that needed immediate attention.  I needed to create a DR plan and I needed to find a place to keep my backups. The full backup I was working with was about 60gig on average. I called up my NAS dudes and was told “we don’t have the space for a full backup that size”.  Ahh, but you do have some space. This is where your DBA creativity skills need to come into play.

Backup Stripping is when a backup is stored in equal chunks across a device but needs to stay on either a tape or disk. It’s my understand that it cannot be on both. It’s supported to single media type only. So we are taking our full backup and slicing it in equal parts. This will also increase your backup throughput. You as the DBA will not have control on how the data is divided SQL Server will attempt to keep the parts equal but if they are different do not be alarmed. This is determined by the speed of the disks. Slower disk may cause some bottlenecks and create unequal chucks of data. It is recommended you try to keep your chucks equal so try to keep your backups on disks that are similar in speed and performance. Additionally if you are going to be creative and are limited on space you can send your chucks of data to different servers.  Yes, this can make recovery more difficult but at least there will be a recovery model.

What is a SQL Blog without some scripting right?

backup database [sqllumberjack] to
disk= ‘d:\temp\sqllumberjack_1.bak’, –D: and E: backups are staying on the local system
disk=‘e:\temp\sqllumberjack_2.bak’,
disk= N’\\2ndServername\D$\sqllumberjack from dbhostserver\sqllumberjack_3.bak’, –These are being sent to another location
disk= N’\\2ndServername\D$\sqllumberjack from dbhostserver\sqllumberjack_4.bak’
noinit

Files sqllumberjack_1.bak, sqllumberjack_2.bak, will be similar in size, whereas files sqllumberjack_3.bak, sqllumberjack_4.bak are similar in size. However, files sqllumberjack_1.bak, sqllumberjack_2.bak, may be significantly larger than files sqllumberjack_3.bak, sqllumberjack_4.bak.

In both scenarios, drive D may run out of space, and you will get an error before the backup completes if drive D has limited space. If you must have files evenly distributed on both disks, you need to use disks that have comparable I/O throughputs.

The script above brings me into my next piece.

Is it best to send large backups across the network just to keep them off your local system? So what is a large back-up. That is for you, the DBA to decide. As a SQL Lumberjack you may have a slow network, with an old slower server, which is limited on space already. I would recommend keeping any backup larger than 2 gig on your local server IF and ONLY IF your server dudes are backing up the server nightly. This can reduce the I/O throughput across the network. We need to remember as SQL Lumberjacks we do not have another server readily available. There is no HA environment, we relay strictly on DR plans that do not have HA. Mirroring PLEASE! “Can I get a witneeess!” No, you cannot. We are straight up gangsters. These are for non-critical applications and non-critical databases after all. Any company will spend the money on HA if it’s a critical database. When a company bids out services, if they are bidding on a critical applications they will adjust to include HA, least they should.

No back-up server readily available. Worst case scenario the server catches on fire. Even if you send your backups across the network to another server you do not have a server to recover to. Your company has to buy a new one. What is the difference if your backups are local or in data center somewhere. Your server dudes have been backing up the server to tape. Those tapes will be used to recover the server. Even if just your database takes a dive, you can still relay on those tapes to recover.

I know I know, point in time recover. Your database has many transactions. You should send your t-logs across the network to your data center. T-logs are small they will not slow down the network. T-logs are your point in time recovery if you have to recover from the tape.

Chances are you will not even touch the full backups in the data center.

Posted in Uncategorized | Leave a comment